
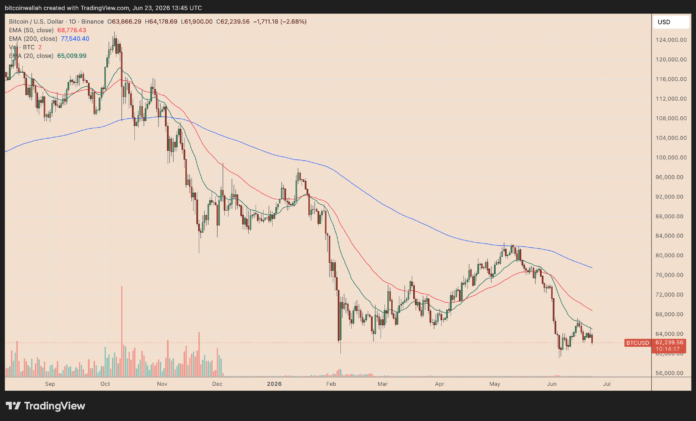

Bitcoin (BTC) has dropped over 8% from its June high near $67,255, putting the $60,000 support level back in focus.
BTC/USD daily chart. Source: TradingView
Key takeaways:
- The SpaceX-led tech market rout is pushing Bitcoin price toward the $60,000 support.
- A decisive breakdown below $60,000 may lead the price toward $56,000 or under.
SpaceX Rout Adds Pressure To Bitcoin’s $60K Support
Bitcoin is getting close to retesting $60,000 as SpaceX’s post-IPO rout erases over $600 billion in market value and shakes risk appetite across speculative assets.
The Elon Musk-led company priced its record IPO at $135 per share earlier in June, raising $75 billion at an implied valuation of about $1.77 trillion, based on 13.08 billion shares outstanding.
Investor demand was strong after the listing. SpaceX shares opened near $150 and later climbed to a post-IPO peak of $211.39 on June 16, pushing its implied market capitalization to nearly $2.8 trillion.
SPCX hourly performance chart. Source: TradingView
Shares have dropped roughly 27% from their peak, pulling the stock back toward $150 and erasing much of the debut rally.
Related: Space X IPO: ‘Bad news’ for tech stocks but what about Bitcoin?
The SpaceX rout is part of a wider tech sell-off. Nasdaq 100 futures fell more than 3% on Tuesday, putting the index on track to erase over $1 trillion in market value. Chip stocks also dropped sharply, with Intel, AMD, Micron and SanDisk leading the decline.
Nasdaq 100 daily performance chart. Source: TradingView
Bitcoin typically trades like a liquidity-sensitive risk asset during market stress. When investors cut exposure to expensive tech and speculative growth names, crypto usually faces similar selling pressure.
In a Tuesday post, analyst Nehal said there’s a high probability of Bitcoin falling under $60,000 if it breaks below $62,200, adding:
“For now, it’s still a range game. Real breakout signals come above $65.7K or below $59K.”
Bitcoin head-and-shoulders pattern sets $56,000 target
Bitcoin’s four-hour chart shows a potential head-and-shoulders pattern, adding technical pressure to the ongoing sell-off.
The left shoulder formed near $64,500, followed by a higher peak near $67,000 that created the head. BTC then failed to reclaim that high, forming a lower right shoulder near $65,000 before turning lower again.
BTC/USD four-hour chart. Source: TradingView
The pattern’s neckline sits around the $61,000–$62,000 area, close to Bitcoin’s current support zone. A decisive four-hour close below that range would confirm the bearish setup and increase the risk of a deeper decline.
The measured downside target sits near $55,000–$56,000, based on the distance between the head and the neckline. Multiple BTC analyses in the past have presented similar downside price targets.
Nevertheless, BTC’s bullish structure remains active as long as it holds above $60,000, with the possibility of returning above $81,000 over the next few months.